When you open NOVA, you’re looking at a live view of your network — but knowing where to focus makes all the difference.
Modern networks generate vast amounts of data. Without the right perspective, it’s easy to miss what actually matters. NOVA dashboards are designed to cut through that noise and help operations teams quickly understand the current state of the network.
This guide explains:
-
What dashboards are designed to show
-
What each section represents
-
How to spot issues quickly without digging into every detail
What NOVA Dashboards Are Designed to Do
It is built to answer one primary question: “Is something wrong right now — and where should I look first?”
They are not designed for deep root-cause analysis or configuration changes.
They are designed for situational awareness.
In other words, dashboards help teams:
-
Understand the overall health of the network
-
Identify abnormal conditions quickly
-
Decide where to drill down next
Think of them as the front door to your operations environment.
Understanding the Key Dashboard Areas
While dashboards can be customised by role and environment, most include a few core elements. Understanding what each of these represents makes it much easier to interpret what you’re seeing.
Status & Health Widgets:
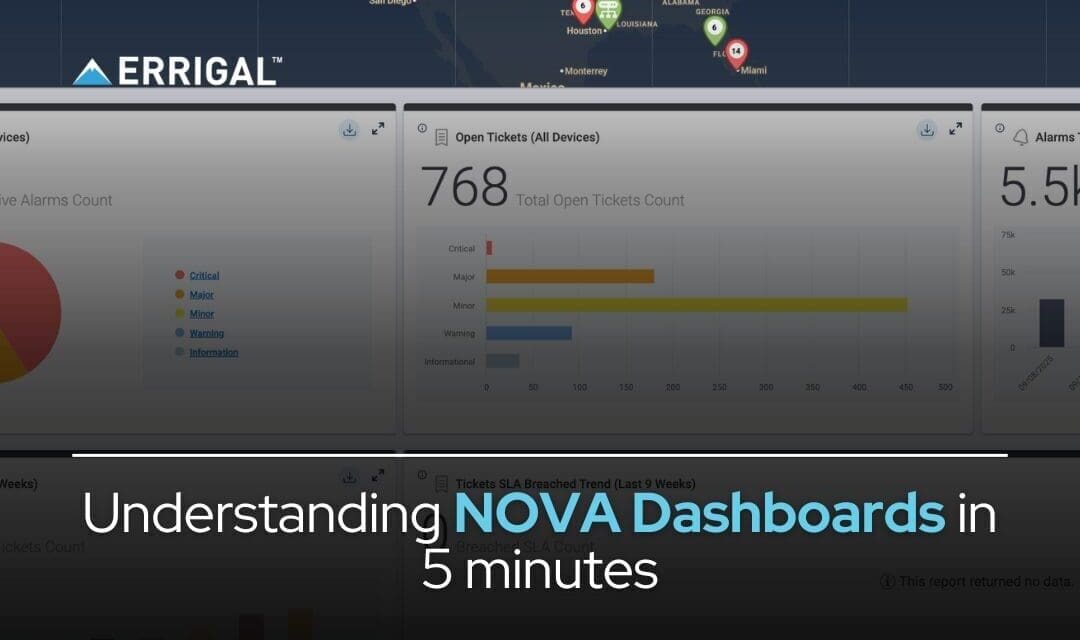
Status and health widgets provide a high-level summary of network conditions.
They typically show: Overall device or network health, alarm counts by severity and up/down or reachable states
These widgets are not about detail — they’re about change. If a value suddenly spikes, drops, or trends in the wrong direction, it’s usually a sign that something needs attention. A stable network rarely looks “perfect,” but it should look consistent.
Alarm Widgets:
Alarm widgets focus specifically on active alarms and their severity. They commonly display: Current active alarms, severity breakdown and alarm trends over time
At a glance, these widgets help answer an important question: “Are we dealing with isolated issues or a wider event?”
A small number of alarms may indicate a localised issue. A sudden increase across multiple severities can point to a larger incident that requires immediate attention.
Grouped or Site-Based Views:
Grouped views organise information by logical structure, such as: Site or venue, device group or network segment
These views help narrow where an issue is occurring without needing to open individual devices.For large or distributed networks, this context is critical. Instead of asking “What’s wrong?”, you can immediately ask “Where is it happening?”
Trend & History Widgets:
Trend and history widgets show how conditions are changing over time.
They help answer questions like: Are alarms increasing or clearing?,Is performance stable or slowly degrading? or Is this a new issue or a recurring pattern?
Trends are often more important than single data points. A slow, steady degradation can be more significant than a brief spike.
How to Spot Issues Quickly Using NOVA
Most teams use dashboards effectively by following three simple steps:
1.Look for sudden changes, not perfection
Dashboards are about identifying anomalies, not achieving zero alarms.
2.Identify which area or group is affected
Use grouped and site-based views to narrow your focus quickly.
3.Click through only when something stands out
You don’t need to analyse every widget — NOVA is designed to guide your attention naturally.
This approach helps teams stay efficient and avoid unnecessary deep dives.
What to Do Next When You Spot an Issue
When something catches your eye:
1.Click into the relevant device, site, or group
2.Review the associated alarms
3.Let tickets and workflows handle the next steps
Dashboards help you see the issue. Tickets and workflows help you resolve it. This separation keeps operations efficient and consistent.
Conclusion:
NOVA dashboards are not about showing everything — they’re about showing the right things at the right time.
By understanding what each section represents and how to interpret changes, teams can: Respond faster, reduce unnecessary investigation and maintain confidence in day-to-day operations
Related Articles:
